Why Single-Cell Thinking Changed the Field
Many classic measurements in molecular and cell biology average signals over large populations of cells. Averages are valuable, but they can hide essential structure. Two samples can have the same average protein level while being composed of very different mixtures: one may be uniform, another may contain distinct subpopulations. If the biology depends on rare states, transient transitions, or cell-\to-cell variability, population averages can mislead.
Single-cell measurement exposes this structure. It reveals heterogeneity in gene activity, protein abundance, signaling states, and spatial organization. It also clarifies which differences are stable traits and which are noise, and it can map trajectories when cells move through time-dependent processes such as differentiation, stress responses, or cell cycle stages.
Value WiFi 7 RouterTri-Band Gaming RouterTP-Link Tri-Band BE11000 Wi-Fi 7 Gaming Router Archer GE650
TP-Link Tri-Band BE11000 Wi-Fi 7 Gaming Router Archer GE650
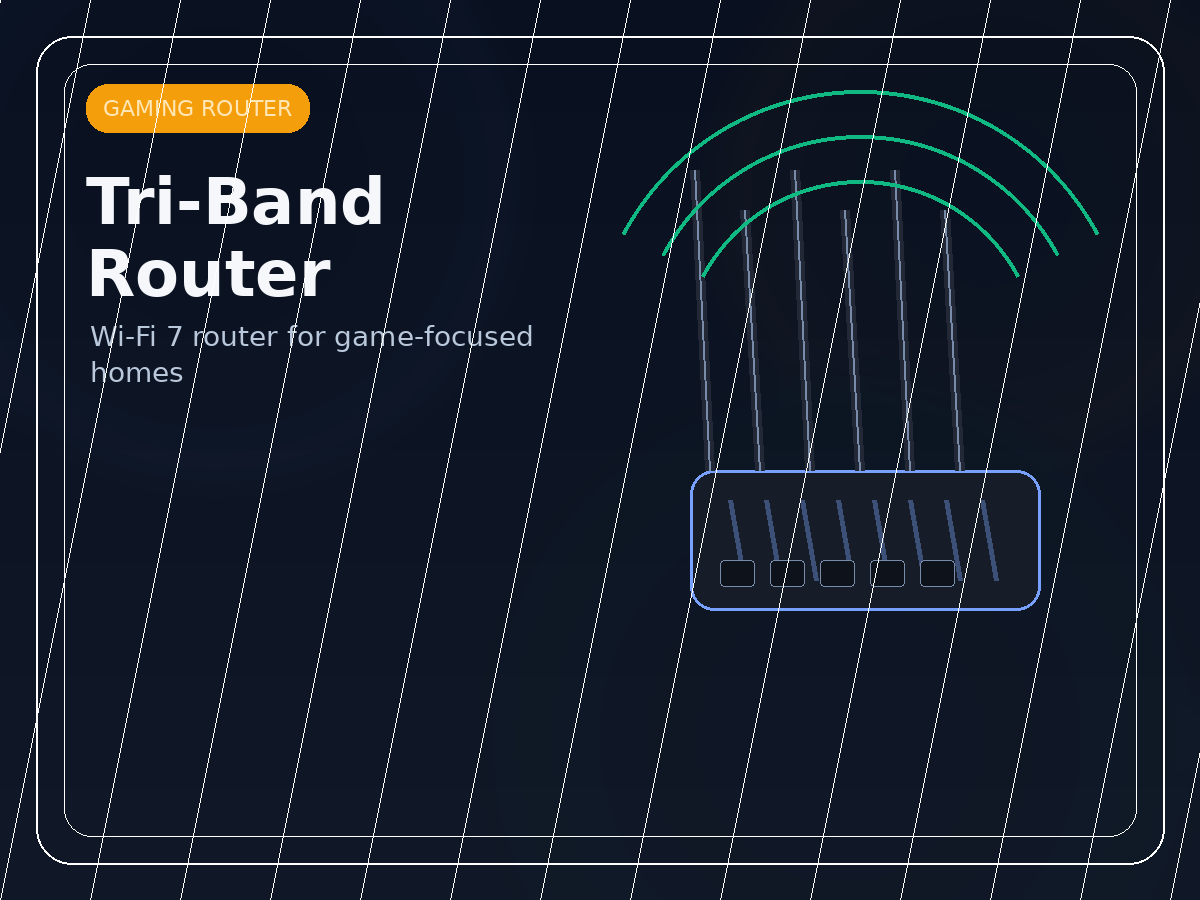
A gaming-router recommendation that fits comparison posts aimed at buyers who want WiFi 7, multi-gig ports, and dedicated gaming features at a lower price than flagship models.
- Tri-band BE11000 WiFi 7
- 320MHz support
- 2 x 5G plus 3 x 2.5G ports
- Dedicated gaming tools
- RGB gaming design
Why it stands out
- More approachable price tier
- Strong gaming-focused networking pitch
- Useful comparison option next to premium routers
Things to know
- Not as extreme as flagship router options
- Software preferences vary by buyer
The promise is big, but so are the risks. Single-cell data is high-dimensional, noisy, and sensitive to technical bias. Interpreting it rigorously requires careful separation of what was directly measured from what was inferred.
A Map of Single-Cell Modalities and Their Strengths
Single-cell approaches span a wide range of measurement types. They differ in what they measure directly, how destructive they are, and how much spatial information they retain.
| Modality | Direct Measurement | Strengths | Typical Limitations |
|—|—|—|—|
| Flow cytometry | Fluorescent markers per cell | Fast, quantitative, robust | Limited marker panel, weak spatial context |
| Mass cytometry | Metal-tagged markers per cell | Larger marker sets, low spectral overlap | Lower throughput than flow, complex preprocessing |
| Single-cell RNA sequencing | RNA fragments per cell | Broad transcript coverage | Dropout noise, indirect link to protein |
| Imaging-based single-cell assays | Fluorescence intensity and location | Spatial context, morphology | Limited multiplexing, phototoxicity |
| Spatial transcript methods | RNA in tissue coordinates | Links state to location | Resolution trade-offs, complex segmentation |
| Single-cell proteomics | Peptide abundance per cell | Protein-level view | Low coverage relative to bulk proteomics |
A key principle is that each modality has its own “measurement geometry.” Flow cytometry yields clean counts for a moderate marker set with minimal spatial detail. Imaging yields rich spatial patterns but struggles with scale and standardization. RNA-based methods yield large feature spaces but require careful handling of missing signals and amplification bias.
Rather than seeking a single perfect method, rigorous studies often combine modalities: imaging for spatial structure, cytometry for robust quantification, and RNA-based methods for broad discovery, with targeted validation at the protein level.
Calibration and Quantification: Turning Signals Into Comparable Numbers
Single-cell measurements are often compared across conditions, days, or instruments. Without calibration, apparent differences can reflect drift rather than biology. Calibration is especially important for fluorescence-based methods and for imaging intensity measurements.
For flow and imaging, use reference standards whenever possible:
- Fluorescent calibration beads to map instrument settings to comparable intensity units.
- Shared control samples processed alongside experimental samples to detect day-\to-day drift.
- Internal reference markers that are expected to remain stable, used as normalization anchors.
For imaging, exposure time, illumination uniformity, and detector saturation can change distributions. Record acquisition settings and keep them constant across conditions. When settings must change, quantify how the change maps to intensity values using standards rather than assuming linearity.
For RNA-based methods, normalization is unavoidable because capture efficiency varies by cell and by gene. The goal is not to create perfect values, but to produce values that preserve true differences while limiting technical distortion. A helpful practice is to validate key transcript-level claims by checking the corresponding proteins, because protein levels integrate over time and are often closer to function.
Quantification also depends on gating and thresholds. In cytometry, gates determine what counts as positive. In imaging, segmentation thresholds determine what counts as part of the cell. Document these choices and test their sensitivity. If a conclusion disappears when a threshold shifts modestly, it is likely fragile.
From Measurements to Inference: The Hidden Steps
Single-cell pipelines often include inference steps that feel like measurements but are not. Examples include:
- Clustering cells into “types” based on similarity.
- Ordering cells along a “trajectory” that is interpreted as a time-like process.
- Inferring pathway activity from sets of genes or proteins.
- Estimating cell–cell communication from ligand and receptor expression patterns.
These steps can be useful, but they are models, not raw facts. Their outputs depend on choices: normalization schemes, distance metrics, batch correction methods, and parameter settings. Two pipelines can produce different cluster boundaries from the same data, especially when subpopulations are subtle.
A robust approach treats inference outputs as hypotheses that must be stress-tested. Stress tests can include:
- Re-running analysis with alternative reasonable parameter choices to see if conclusions persist.
- Using independent markers to validate inferred groups.
- Verifying predicted trajectories with time-resolved experiments when possible.
- Checking whether inferred signaling states correlate with direct biochemical markers.
This mindset prevents a common failure: describing a modeling artifact as a biological discovery.
Heterogeneity Has Multiple Causes: Biology, State, and Noise
Not all variability is meaningful biology. Single-cell distributions mix several contributors:
- Stable differences, such as lineage or long-lived regulatory states.
- Reversible states, such as cell cycle phase, nutrient availability, or transient stress.
- Spatial microenvironment effects in tissues.
- Technical noise: sampling, amplification, staining variability, and segmentation errors.
Disentangling these requires design. For example, if a question concerns signaling variability, control for cell cycle and size, because both can shift protein abundance. If a question concerns differentiation states, track time or use lineage markers, because snapshot data can confound path direction.
A useful practice is to include “nuisance covariates” explicitly in analysis: cell size, DNA content, mitochondrial content proxies, and batch indicators. The goal is not to remove biology but to prevent known technical or contextual factors from being misread as new biology.
Designing a Single-Cell Experiment That Can Answer a Specific Question
Single-cell projects often fail by being too open-ended. High-dimensional data can tempt researchers into post hoc storytelling. A strong design begins with a precise question and a plan for what would count as evidence.
Examples of precise questions include:
- Does a perturbation change the proportion of cells in a specific functional state?
- Does it change the intensity of a signaling marker within a defined state?
- Does it create a new state that was absent in controls?
- Does it alter spatial localization of a state within tissue?
Each question implies a sampling plan and a validation plan. Proportion changes require adequate cell counts and replicate structure. Intensity shifts require careful calibration and consistent staining. New-state claims require strong batch control and orthogonal markers.
Replicates are non-negotiable. Single-cell datasets can contain thousands of cells, but without biological replication they can still be untrustworthy. A large number of cells from one sample does not replace multiple independent samples.
Controls should include:
- Technical controls that measure background and spillover in fluorescence panels.
- Batch controls that reveal processing drift.
- Negative controls for perturbations, including vehicle and mock treatment where relevant.
- Positive controls that confirm the assay can detect expected changes.
When these elements are present, single-cell data becomes a measurement tool rather than a hypothesis generator alone.
How to Read Single-Cell Distributions Without Fooling Yourself
Single-cell outcomes are distributions, not single numbers. Two distributions can differ by mean, variance, tail behavior, or multimodality. Reporting only an average can erase the very signal single-cell methods are designed to reveal.
A disciplined distributional interpretation includes:
- Effect size: how large the shift is relative to the spread.
- Fractional change: how much of the population moves into or out of a state.
- Tail behavior: whether rare extreme states appear or vanish.
- Robustness: whether the pattern persists across biological replicates.
Statistical tests are useful, but they are not the endpoint. With large cell counts, tiny differences can become “significant” while being biologically trivial. Conversely, rare-state biology may be important even when classical tests lack power. Prefer to pair statistical summaries with visualizations that show the full distribution, such as density plots, ridge plots, or cumulative distribution curves.
Finally, keep the unit of inference aligned with the design. Cells are measurements, but biological replicates are the evidence. Treating thousands of cells from one sample as independent evidence exaggerates certainty. Use replicate-aware models or aggregate per-sample summaries before comparing conditions.
Where Errors Hide: Practical Failure Modes
Single-cell studies are particularly sensitive to subtle errors.
- Doublets and multiplets: two cells measured as one can create false hybrid states.
- Dropout in RNA-based methods: missing transcripts can distort inferred pathways.
- Over-correction in batch adjustment: real biological differences can be washed out, or artificial alignment can be imposed.
- Segmentation mistakes in imaging: incorrect cell boundaries can shift signal distributions.
- Marker instability: some markers change rapidly with handling, temperature, or time in buffer.
These failure modes are manageable when acknowledged early. Doublet detection can be built into preprocessing. RNA dropout can be reduced with improved capture chemistry and handled with models that treat missingness explicitly. Batch correction should be guided by experimental design, not used as a universal fix. Imaging segmentation should be validated by manual checks on representative regions. Marker stability should be tested with time-course handling controls.
A simple rule helps: if a conclusion depends on a small \subset of cells, ensure that \subset is not explainable by a known technical artifact.
Integrating Single-Cell Results Into Mechanistic Molecular Biology
Single-cell methods often identify patterns. Mechanistic molecular biology explains patterns. The integration step is where strong work happens.
Suppose a single-cell dataset reveals a rare high-stress state after a perturbation. Mechanistic follow-up might ask:
- Which pathway triggers the state, and is it upstream or downstream of the perturbation?
- Is the state protective or harmful?
- Can targeted intervention suppress or enhance the state without changing unrelated functions?
These questions can be addressed with targeted perturbations, pathway markers, and functional assays. Single-cell readouts can then be used as sensitive endpoints for mechanism rather than as endpoints by themselves.
The best single-cell work respects causality. It separates correlation from mechanism and recognizes that a “state” is a description, not an explanation. When single-cell maps are paired with precise interventions and flux-aware measurements, they become a central pillar of modern molecular and cell biology.
Books by Drew Higgins


Bible Study / Spiritual Warfare
Ephesians 6 Field Guide: Spiritual Warfare and the Full Armor of God
Spiritual warfare is real—but it was never meant to turn your life into panic, obsession, or…

Leave a Reply